Code Toolkit: Python, Spring 2026
Midterm review — Class notes
These notes are based on a collection of questions that I have gotten from students recently and in the past about techniques related to working on the midterm project.
- Adding text
- Implementing a moving object
- Implementing many moving objects
- Moving raster images
- Functions with arguments and return values
- Working with CSV files
- That's it!
I. Adding text
This example illustrates all the basic principles of working with text in Python / Processing:
size(800,800)
background(0)

arialblack = loadFont("Arial-Black-48.vlw")
arial24 = createFont("Arial", 24)
georgia16 = createFont("Georgia", 128)

score = 42

textFont(arialblack)
fill(255,0,0)
textSize(128)
text("Hello", 100, 300)

textFont(arial24)
fill(0,255,255)
textSize(32)
text("Friends", 100, 350)

textFont(georgia16)
fill(0,255,255)
textSize(32)
text("Your score: "+str(score), 100, 450)
All the new commands here are documented in the Python Processing reference, in the Typography section.
You actually draw text to the screen with
the text() command, which you can see illustrated
on lines 13, 18, and 23. You can see that this command takes
a string of text that you want to display
(i.e., characters in between double-quotes, "
"), and two arguments that correspond to the x and
y location of this text on the screen.
If you want to render dynamic text onto the screen, use
the str() variable to convert a variable value into
a string, and concatenate two
string values together using +. You can see this in
action on line 23, which assumes that I have a variable
called score, which has some numeric value. (In
this case created on line 8.)
You can control what font to use to render this text by first
creating or loading the font that you plan to work with. There
are two ways to do this in Processing, illustrated on lines
4-6. Line 4 loads a predefined
.vlw file which has to have been created already
and saved into your sketch folder. You can create this file from
the PDE menu by going to "Tools" > "Create
Font...", specifying the font face and size you want, and
clicking "OK".
If you would prefer, you can create the font dynamically at
runtime using the createFont() command, as
illustrated on lines 5 & 6. In this way, you can create the
font when the program starts running, without having to create
the .vlw file in advance. You specify the font face
(which has to exist on your machine, exactly as typed here) and
the size. I'm guessing there might be some performance cost to
doing it this way because Processing has to create the font
while your code is running. I am assuming you would not notice a
different unless you were creating many fonts.
In either case, you either load or create the font, and assign
it to a variable. Similar to the process of
calling loadImage() and saving that image to a
variable which you can then draw later. In this case, you can
use any of these font variables later on when you are trying to
write text.
You specify which font to use with the textFont()
command, as you can see on lines 10, 15, and 20. This command
works similarly to other commands that control how later things
are drawn, like fill(), which I have also included
here to show how they are similar. textFont()
specifies the font that will be used to render any text that
comes after with the text() command, and that will
be the "active" font until you change it with another call
to textFont().
You can see that I am also using textSize(). That
specifies the size of the text that you are going to
write. Ideally, this value should probably be the same as the
value you used when you created or loaded the font. If you use a
different value, you may get some digital distortion, as you can
see this in action on line 4 in which I have created a font with
size 48, and on lines 12 and 13 in which I am then using that
font to draw text with size 128, giving some blurriness in the
draw window. (If I change textSize() to 48, or if I
create a new .vlw file with size 128, then this
distortion goes away.)
II. Implementing a moving object
Another question: How you can have the user initiate a projectile that flies across the screen? For discussion, we imagined this was a game like an arcade basketball throw, in which the player has a container with some number of balls that they can pick up and throw. The balls roll back down to the container and they can pick them up and throw again. We started out with just one ball.
My sample code is here:
x = -10
y = 400
speed = 0

def setup():
    size(800,800)

def draw():
    global x, speed
    background(255)

    fill(0)
    ellipse(x,y, 10,10)

    x = x + speed
    if x > width:
        x = -10
        speed = 0

def mousePressed():
    global x, y, speed
    if x < 0:
        x = 0
        y = mouseY
        speed = 10
Lines 12 and 13 draw the ball at some x, y location. Then line
15 moves the ball with our basic "x = x +
1" pattern to increment a variable.
Lines 1 and 2 set the initial values of the ball location. Note
that initially the x value is -10. This is so that
the ball does not appear anywhere on the screen before the user
throws it. Also, speed is set to 0 so
that initially the ball is not moving.
After moving the ball on line 15, we use an if
statement to check if the ball has moved off to the right of the
screen, and if so, we reset its position back offscreen
with -10 and set its speed back to 0.
Now for the user to initiate the throw, we use a def
mousePressed block. In this event
handling block, we want to set
the xposition of the ball to 0, so it
is now visible on the left of the screen, and set
the speed to 10 so the ball moves
across the screen. (We also decided that we would set
the y value of the ball to be wherever the mouse
was when the user clicked.) But! we put these three
lines in an if statement block that checks if
the x value of the ball is less than zero, because
we only want the user to be able to throw the ball if its
position has been reset back to -10, i.e. in our
game concept, if the basketball has rolled back down and is in
the container again.
III. Implementing many moving objects
After finishing the above example I showed how you might implement this same interactive example but with multiple balls. That code looks like this:
x = []
y = []
speed = []
num_balls = 3
current_ball = 0
def setup():
size(800,800)
i = 0
while i < num_balls:
x.append(-10)
y.append(400)
speed.append(0)
i = i + 1
def draw():
background(255)
i = 0
while i < num_balls:
# draw each one:
fill(0)
ellipse( x[i],y[i], 10,10)
# move each one:
x[i] = x[i] + speed[i]
# check each one:
if x[i] > width:
x[i] = -10
speed[i] = 0
i = i + 1
def mousePressed():
global current_ball
if x[current_ball] < 0:
x[current_ball] = 0
y[current_ball] = mouseY
speed[current_ball] = 10
current_ball = ( current_ball + 1 ) % num_balls
Notice now on lines 1 - 3 that the
variables x, y, and speed are
all lists.
I am using the variable num_balls to specify how
many balls we are allowing the player to throw.
Then, in setup() on lines 12-17, we are looping
over the number of balls, and using append() to add
a value to each list for each ball — so an x
value, a y value, and a speed value
for each ball.
Next, in draw() I have a loop with the same values
(starting at i = 0, running while i <
num_balls, and incrementing by 1). Each
iteration, we are doing the same actions as in the single-ball
example, except that now we are using [i], and
taking those actions once per ball. So for each ball, we are
drawing it (lines 25-26), moving it (line 29), and checking if
it has gone off the screen (lines 32-34).
Finally, in def mousePressed(), we are doing the
same thing. Repeating the code from the single-ball example, but
now operating on list values instead of single-valued
variables. But wait! Which list item do we want to
operate on here? We are not in a loop, because this is where the
user throws a ball. So we only want to manipulate one. Which one
should it be? For this, I have added a new variable
called current_ball. This will keep track of the
next ball that the user is going to throw. Notice that on line 7
I initially set this to 0. Now, in
the mousePressed block, I'm going to use that
as the index of my lists. So that the first time the user throws
a ball, we manipulate all the first values of our three lists
(i.e., the 0 indexed values). Then, at the end
of def mousePressed, we increment this variable, so
that the next time the user presses the mouse, we will
manipulate the next ball values in our lists.
But wait again! There is one more issue here. If we
keep incrementing this variable,
eventually current_ball will become greater
than num_balls and we will get
an IndexError. The solution? Make sure that after
you increment current_ball, you check to reset it
to 0 if it has gotten too large. You could do that
like this:
current_ball = current_ball + 1
if current_ball > num_balls:
    current_ball = 0
or, more concisely, you could write that like this:
current_ball = ( current_ball + 1 ) % num_balls
For a refresher of the modulo operator, refer back to
the Week 5 class notes, the
review of that during
Week 6,
or another example using this from
Week 7 on lists.
(jump back up to table of contents)
IV. Moving raster images
Question: How we can draw raster images and have them move around. Here is a code snippet to do that, presented without comment:
imgX = 100

def setup():
    global img
    size(800,800)
    img = loadImage( ... )

def draw():
    global imgX

    image(img,imgX,400)

    imgX = imgX + 1

    if imgX > width:
        imgX = 0
(jump back up to table of contents)
V. Functions with arguments and return values
We also talked about how you can use functions with arguments and return values. I will share another code snippet without comment, because we didn't have time to talk about this in class today, but if you are curious about any of this code, please don't hesitate to ask! I would be happy to explain.
def setup():
    size(600,600)

def draw():
    my_function(5)
    my_function(7)

    print("The midpoint is: ", midpoint(10,20) )

def my_function(n):
    rect(n,10,10,10)

def midpoint(x,y):
    m = ( x + y ) / 2
    return m
(jump back up to table of contents)
VI. Working with CSV files
I was asked for some advice about how to work with CSV files.
CSV stands for comma-separated values and is a very simple data format. You can think of this data format as similar to a spreadsheet: a bunch of rows in which each row has the same number of columns. CSV represents a spreadsheet as one row per line, and within each row, each value is separated by commas (as the name implies).
Think back to our discussion from week 5 about nested loops. Since a CSV file is similar to a spreadsheet, and a spreadsheet is like a kind of grid, the kind of algorithms you will need to process CSV files will be similar to nested loops: looping over all rows, and for each row, looping over all columns. Sometimes in computer science people call this an N-squared class of algorithm.
As an example, let's say we have this spreadsheet:
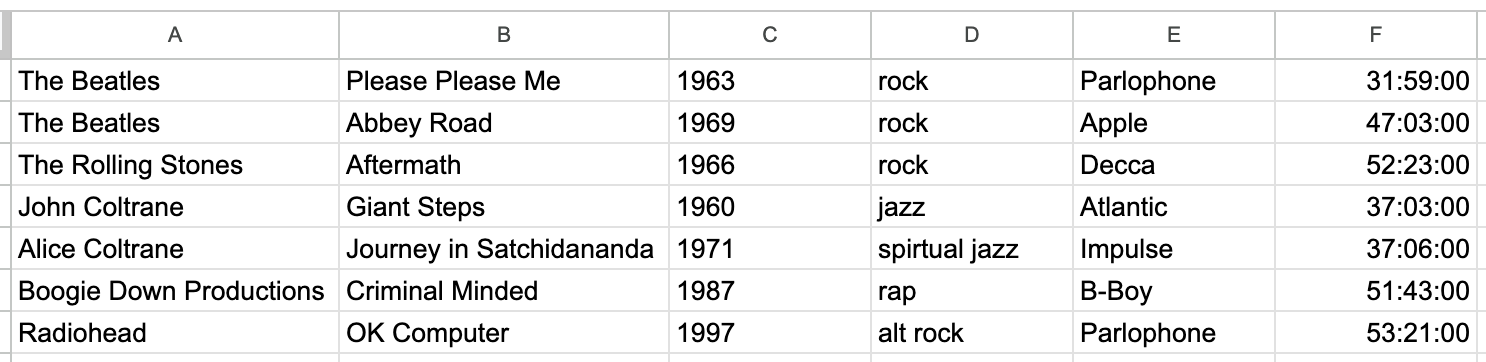
.txt extension so that you can view it
in the browser. If you want to work with this file using my code
examples below, make sure that you download it and rename it
to data.csv.)
The simplest program to access this CSV file would probably be
something like the below. Python has
a csv library, which we can use
for this purpose. As you can see, that
is imported on the first line.
import csv

csv_file = open('data.csv')

csv_reader = csv.reader(csv_file)

for row in csv_reader:
    for value in row:
        print value + " //",
    print("")
Note the nested loop. This code opens the CSV
file for reading, and saves that in a variable called
csv_reader. Then it loops over every row in the
file, and for each row, it loops over every value within
that. (That funny trailing comma , is some weird
syntax to let me print without printing a newline.) I printed
two slashes here (//) instead of commas just to mix
things up a little bit. But the forward slashes are where the
commas are in the file.
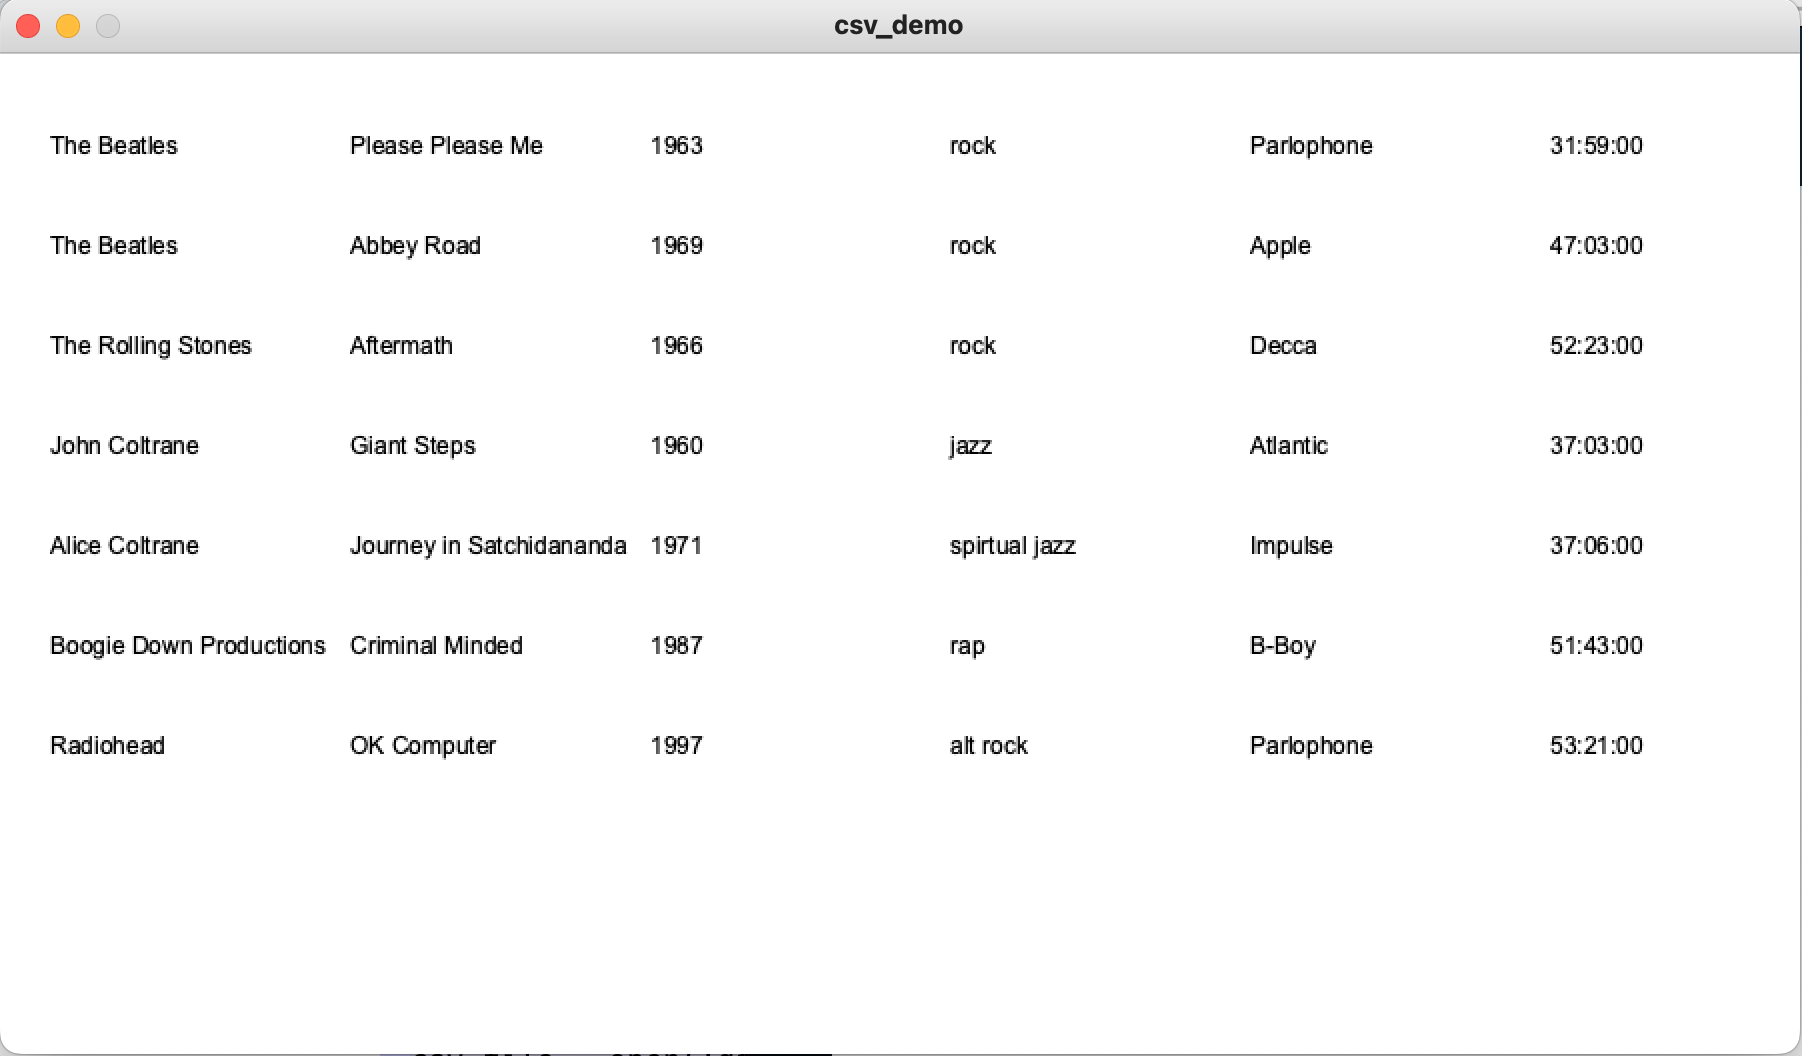
If you want to make that a little bit more interesting, instead of printing the text to the console, you could integrate the techniques from section I above and draw the text into the draw window:
import csv

size(900,500)
background(255)

arial12 = createFont("Arial", 12)
textFont(arial12)

fill(0)
textSize(12)
x = 25
y = 50

csv_file = open('data.csv')

csv_reader = csv.reader(csv_file)

for row in csv_reader:
    for value in row:
        text(value,x,y)
        x = x + 150
    x = 25
    y = y + 50
That would produce output that should look like this:
Going further, if you will be using this data to create other graphics, you probably don't want to just draw text to the screen, and instead what you should do is save all this CSV data into some kind of data structure which you can then work with elsewhere in your program.
Using the only data structure we have learned so far (the list) what kind of data structure could you come up with to represent a CSV?
My suggestion: a list of lists. This data structure kind of mimics the nested loop idea, which was a loop of loops.
In the below code, I create an empty list called data_list, then loop over the CSV file, and simply append each row of the file to data_list. This produces that list of lists structure; and if you want to verify this, I have printed out the data structure at the end so you can see the default way that Python displays this kind of data structure.
import csv

csv_file = open('data.csv')

csv_reader = csv.reader(csv_file)

data_list = []

for row in csv_reader:
    data_list.append(row)

print(data_list)
If you are using data from a CSV file for data visualization, you will probably want to do something graphical with those numbers. Below is an example of how to take the previous code snippet that generates a list of lists, and use that to generate some visuals. To do that, I'll work with a different CSV file. Let's say we have the following data:
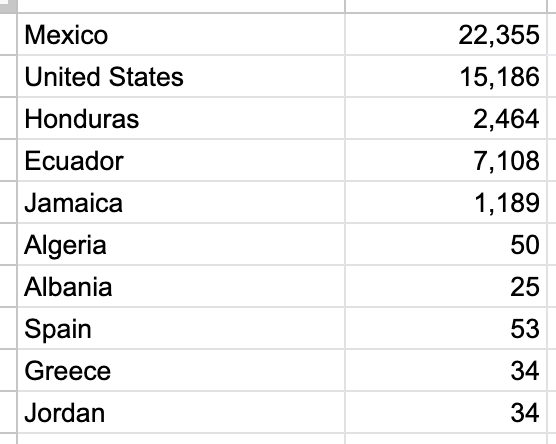
Which was in this CSV file:
data2.csv (As above, I named
this file with a .txt extension so that you can
view it in the browser. If you want to work with this file using
my code example below, make sure that you download it and rename
it to data2.csv.)
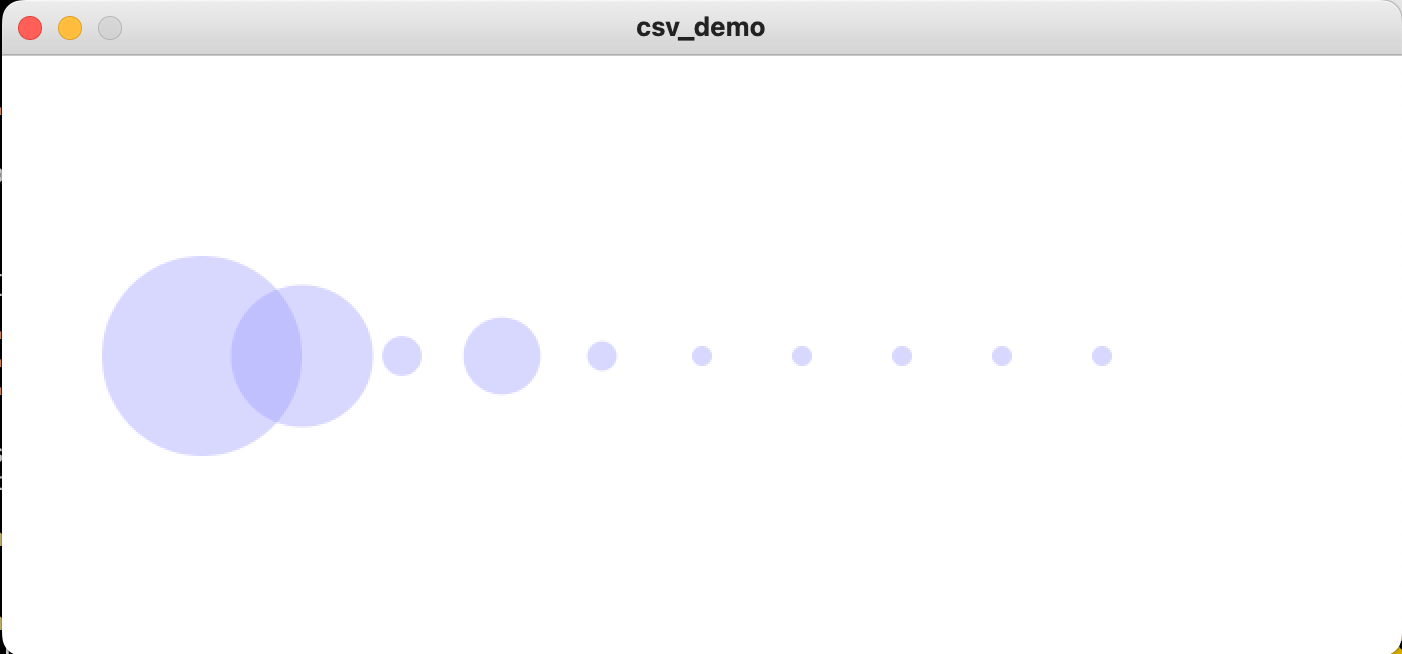
Modifying the previous code snippet to do something visual with this could look like this
import csv

size(700,300)
background(255)
fill(155,155,255,100)
noStroke()

csv_file = open('data2.csv')

csv_reader = csv.reader(csv_file)

data_list = []

# Use these to determine the min and max values in our data set
min_value = None
miax_value = None

for row in csv_reader:
    data_list.append(row)

    # The data in this value has numbers with commas; remove them
    row[1] = int(row[1].replace(",",""))

    # Do some comparison checks to find the min and max values in the data set
    if not min_value or row[1] < min_value:
        min_value = row[1]
    if not max_value or row[1] > max_value:
        max_value = row[1]

x = 100
for data_point in data_list:

    # Use map() to translate the data set values into the range we wish to work with visually
    circle_size = map(data_point[1],min_value,max_value,10,100)

    # Draw an ellipse using the circle_size variable
    ellipse(x,150,circle_size,circle_size)

    # Increase the x value so our circles are spread out horizontally
    x = x + 50
When I run that, I see the below:
One last tip here. If your CSV data is formatted such that you need to create the equivalent of a pivot table to work with it, here is a Gist showing how to do that.
(jump back up to table of contents)VII. That's it!
That's all, everyone. Good luck on the midterm! If you have any questions, don't hesitate to ask.