Code as a Liberal Art, Spring 2024
Unit 2, Lesson 1 — Monday, March 4
Data / Metadata / Data structure(s)
Digital stuff is often thought of as divided into algorithms and data. Sometimes these categories are described as, on the one hand, computer programs of executable instructions or actions, and on the other hand, the digital objects that those instructions act on. We might even go as far as calling this a kind of "digital ontology", in the sense that all digital stuff can plausibly be divided into one of these two categories.
In Unit 1 we looked at some algorithms, made some patterns, and generated some digital files, but we didn't really think about those files as data, per se. If you generated graphical patterns using loops and the modulo operator, they likely looked somewhat like data visualizations, but there wasn't actually any data there that we were visualizing. It's almost like they were visualizations of pure process, visualizing the patterns of algorithm. Similarly for your algorithmic collages: for the most part these used randomization as the primary composition technique, although if you wrote code to process and filter any of your images, you were already beginning to think of them as data to be analyzed in some sense.
For Unit 2, we are going to turn our attention more toward data. Where Unit 1 focused on formalist digital explorations and using algorithms for creative, generative production, Unit 2 will shift to how data is structured, how it is gathered, and how we can use algorithms as techniques of analysis.
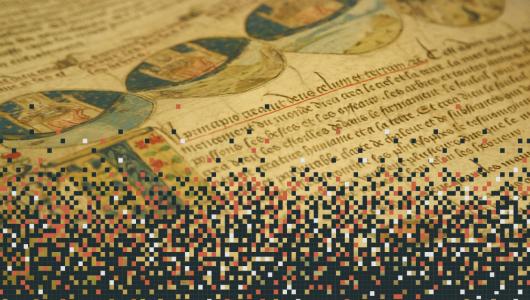 I poached this image from an online course
titled "Introduction
to Digital Humanities" at Harvard. I like that it looks like
it's building on the work of Unit 1, in the direction of Unit
2. We will be talking about the digital humanities in the coming
weeks.
I poached this image from an online course
titled "Introduction
to Digital Humanities" at Harvard. I like that it looks like
it's building on the work of Unit 1, in the direction of Unit
2. We will be talking about the digital humanities in the coming
weeks.
Table of contents
Table of contents for the topics today: (As always, click each to jump down to the corresponding section.)
- Data
- Data structure: lists, tuples, and dictionaries
- Using data structures to gather data
- Data and metadata
I. Data
Data comes from the Latin dare, meaning "to give", and more specifically, it comes from datum, which is the past participle of this root, conjuring a sense of "something given." Data is the plural of datum - as if to say "datums". This sense sounds awkward to our ears today as we usually speak of data as a singular. (We'd probably say "There is much data", not "There are many data", even though the latter is probably more strictly grammatically correct.)
This etymology of data as something given alludes to a sense of data as something that is or was already there, a starting point, perhaps even something that is "raw". In this sense, data is often thought of as something to gather, to mine, to extract, harvest, or reap. But as you saw in the readings for this week, data is never something that is plainly already there. (Some scholars have even written that the term "raw data" is an oxymoron.) Data is never something that is neutral or objective. Rather, data is always shaped, organized, and structured. Thinking of data in this way emphasizes the subjective aspect of data. We might even say that data structure is in the eye of the beholder (or the gatherer, or the analyst). There is almost always more than one way to structure a given collection of data, as we'll see today.
The politics of data is a frame for thinking about who collects data, from whom, how, and to what ends. (From Harold Lasswell.) This thinking affords us the opportunity to ask whether we're comfortable with various processes of data mining, or what we might call data extraction and data accumulation. When and under what circumstances is this OK, and when might it be something that we should push back on? Is data about me something that I in a sense own, as if it is private property? Or is it something that anyone with a data gathering algorithm should consider themselves to have free access to? Think about how other power dynamics within society may interplay with who has access to the means of data gathering and processing.
In this unit we will touch on programming operations for structuring data, techniques for gathering data, and algorithms for analyzing data. Hopefully this hands-on work will afford you opportunities for some new insight about some of the above questions.
II. Data structure: lists, tuples, and dictionaries
The topic of data structures is an enormous one in computer science. Many undergraduate computer science curricula will dedicate an entire semetser just to learning various data structures, when they should be used, and how they operate. Finding and optimizing data structures is an ongoing area of computer science research today. We will be thinking about data structures throughout the semester (indeed, we already have) but we will only spend a few weeks with them as the center of our attention, so the scope of this focus will be necessarily brief. We will focus on a few of the most commonly used data structures, how they are used in Python, how they can be combined, and when you might want to use one over another.
We'll start our work today by working interactively (entering commands into the Python shell and immediately seeing their output results) and then build to craft Python code files.
Make a new folder to work with this week. I'll call
mine Unit 2, Lesson 1 and recommend
that you do the same. Open a new window in VS Code and drag that
folder in.
a. Lists
We have already been working with one common Python data structure: lists. A list is an ordered sequence of values. In Python, those values can be heterogenous. In other words, they can all be different types. Other programming languages are not so forgiving and require all items in a list to be the same kind of thing - i.e., all numbers, or all text. But in Python we can mix it up.
Let's look at some of the operations of lists by working interactively in the Python shell. Many of these commands we have already seen and been using, but I'm putting them here as a more formal introduction and as a lead in to other data structures we'll be talking about today.
-
assign a list to any variable using the assignment
operator (i.e. the equal sign
=) - create a new list using square brackets
- new lists can be created empty or with items in them
-
use
print()to print a list with all its contents -
use
append()to add new items to the end of a list -
use
pop()to remove an item from a list, specified by its index number — e.g.pop(0)to remove the first item (remember, always starting with0) - use square bracket notation with a number index a list, which means to access a specific value in a list based on it's position
-
get the size of a list with the
len()command -
check if a value is in a list with the
incommand
And here is how each of those commands would look in the Python
shell. (Remember: pay careful attention to the command
prompts in my notes here. $ indicates
the default command prompt that you get in Terminal,
while >>> is the Python shell,
which you can run by typing python3
or python at the command prompt.)
$ python3
>>> my_list = []
>>> my_list = [101, 13, 42, "a", "N", "xyz"]
>>> print(my_list)
[101, 13, 42, 'a', 'N', 'xyz']
>>> my_list.append("spaghetti")
>>> print(my_list)
[101, 13, 42, 'a', 'N', 'xyz', 'spaghetti']
>>> my_list[0]
101
>>> len(my_list)
7
>>> 101 in my_list
True
>>> my_list.pop(0)
101
>>> len(my_list)
6
>>> 101 in my_list
False
Again, this process of using square bracket notation to access a
specific item in a list by number is
called indexing the list. The number in
brackets refers to the position in the list of the value that
you want, and is called the index. Remember
that list positions always start at 0. You can also
use variables as the index:
>>> i = 3
>>> my_list[i]
'a'
Using variables as the list index like this is useful because then you can reference the items from a list within a loop for example. A process I usually describe as "looping over a list". Here I'm looping over just a part of this list, just to illustrate that one needn't loop over the whole thing:
>>> for n in range(3,6):
...   print(my_list[n])
...
a
N
xyz
We have already been using lists for several things. We saw how
lists can be used to represent the data of a digital image. In
this case, each value of the list represented a pixel color,
usually specified as (red, green, blue). So if an
image was 10 pixels wide and 10 pixels tall, this list of pixel
color data would be 100 in total (10 x 10). So far you have
mainly been accessing image data by looping over the image file
as both x and y, because the Python
Image Library gives you a special
command, getpixel(), to do this.
But you could also access the data of an image by looping over
image data as one continuous list of pixel values using the PIL
command getdata(). You can see this in action with
the following Python commands, working with this very small
image (u2-1-small-image.png) which is only 4 pixels tall and 4 pixels
wide.
Right-click on the image file link above and save it into your folder for this week. Then open a terminal in VS Code and type the following commands:
$ python3
>>> from PIL import Image
>>> im = Image.open("u2-1-small-image.png")
>>> im.size
(4, 4)
>>> pixels = list(im.getdata())
>>> pixels
[(0, 0, 2), (118, 119, 121), (112, 113, 115), (0, 0, 0),
 (76, 77, 79), (159, 160, 162), (150, 151, 153), (255, 255, 255),
 (62, 63, 65), (95, 96, 98), (104, 105, 107), (50, 50, 52),
 (48, 49, 51), (76, 77, 79), (76, 77, 79), (44, 44, 44)]
>>> len(pixels)
16
>>> pixels[7]
(255, 255, 255)
Note that the length of this list (len(pixels)) is
16. Why? (Highlight to see.) Because an
image that is 4 pixels wide and 4 pixels tall has 4x4=16 total
pixels. Now if you wanted to operate on this image data,
you would not do the nested loop that I spoke
about in Unit
1 Tutorial 4, but
instead you could loop over the image as one sequence of pixel
values — in other words, with one single for
loop. To illustrate this, notice how I
wrote pixels[7] which returned the eigth pixel of
the image (which in this case is white: 255, 255, 255). Of course, working this
way it would be difficult to think about the specific x,y
location of a given pixel in the image. But there are advantages
of working both ways.
It is important to keep in mind that data structures can contain other data structures.
To illustrate this, let's think about a different data structure for working with digital images. Because a digital image is typically a two dimensional object (it has a width and height), it probably makes sense to think about the pixels of a digital image as stored in a two dimensional data structure. To achieve this, instead of one list of many pixel values, we could make a list corresponding to the rows, then each item in that list is itself another list which corresponds to all the pixels in that row. In the Python shell, for the above 4 x 4 image, that would look like this:
>>> img = []
>>> img.append( [(0, 0, 2), (118, 119, 121), (112, 113, 115), (0, 0, 0)] )
>>> img.append( [(76, 77, 79), (159, 160, 162), (150, 151, 153), (255, 255, 255)] )
>>> img.append( [(62, 63, 65), (95, 96, 98), (104, 105, 107), (50, 50, 52)] )
>>> img.append( [(48, 49, 51), (76, 77, 79), (76, 77, 79), (44, 44, 44)] )
>>> img
[ [(0, 0, 2), (118, 119, 121), (112, 113, 115), (0, 0, 0)],
[(76, 77, 79), (159, 160, 162), (150, 151, 153), (255, 255, 255)],
[(62, 63, 65), (95, 96, 98), (104, 105, 107), (50, 50, 52)],
[(48, 49, 51), (76, 77, 79), (76, 77, 79), (44, 44, 44)]]
Notice that I create img as an empty
list [], and then each time I
called append(), I am adding another list
into img, because the argument
to append() each time is also contained in square
brackets.
So what I have here is a list of lists.
Common student question. Does Python somehow know this is an image? No, Python does not think of this data structure at this point as automatically an image in any special way. It is just a data structure for storing numbers, that we are thinking of as something that represents pixel values. We could use this data, structured in this way, to pass in to a library like Pillow to make it into an image. This illustrates how data can have an abstract quality. We could also use this same data structure if we were implementing some kind of spreadsheet application, for example. Or really, any other kind of data that had a "two dimensional" structure. Say, if we were implementing a chess or checkers game.
In this arrangement, the text in blue would correspond to the second row of pixels. You could access this single row of this data with a regular index:
>>> img[1]
[(76, 77, 79), (159, 160, 162), (150, 151, 153), (255, 255, 255)]
And you could access a single item in that row like this: (Note that
row is not a special keyword here.)
>>> row = img[1]
>>> row[3]
(255, 255, 255)
You could shortcut this by using two indices at once, like this:
>>> img[1][3]
(255, 255, 255)
And you can even use the double index notation to modify values, like this:
>>> img[1][3] = (0,0,0)
>>> img
[[(0, 0, 2), (118, 119, 121), (112, 113, 115), (0, 0, 0)],
[(76, 77, 79), (159, 160, 162), (150, 151, 153), (0, 0, 0)],
[(62, 63, 65), (95, 96, 98), (104, 105, 107), (50, 50, 52)],
[(48, 49, 51), (76, 77, 79), (76, 77, 79), (44, 44, 44)]]
Notice that I've changed the last item in the second row, as
indicated by my indices.
b. Tuples
Each of these pixel values with its red, green, and blue components (or hue, saturation, and brightness if you're working with that mode) is called a tuple. This weird word comes from thinking about: a pair, a triple, a quadruple, quintuple, sextuple, septuple, octuple, etc, etc, and wanting to generalize that idea. Hence, an n-tuple, or simply, tuple.
List lists, Python considers tuples as sequences: they are stored in sequential order, meaning you can access their values by numerical index. The main difference between a list and a tuple is that a tuple cannot change. It's called immutable.
So you can think of a list as a dynamic way to store an ordered sequence of values, that may grow or shrink as data is added, removed, filtered, sorted, or re-organized. But a tuple is a way to represent two or three numbers together. Like the x, y coordinates of a point on a grid.
Here is an example of creating a tuple, accessing its individual values by index, and attempting to modify the second value:
>>> t = (50, 75)
>>> t
(50, 75)
>>> t[0]
50
>>> t[1]
75
>>> t[1] = 100
Traceback (most recent call last):
  File "<stdin>", line 1, in <module>
TypeError: 'tuple' object does not support item assignment
Now that you know what a tuple is, hopefully some syntax we've already been using will make a little more sense. When we try to get or put a specific pixel value using PIL, it looks like this: (from Unit 1, Lesson 4)
pixel = new_img.getpixel((x,y))Note those strange double parenthesis?
((
      ))
. That's because this command takes a
single tuple as its argument. So you are really
passing in a single tuple here with the
value (x,y). Looks weird, but maybe now a little
clearer.
c. Dictionaries
One of the most powerful data structures in
Python is the dictionary. Like a regular
dictionary, in which you can look up a word and get a
definition, in a Python dictionary (often called
a dict) you can look up a key and
access a value. A dictionary creates
a mapping between keys and values; or, we
might say it creates a set of key-value pairs.
Dictionaries have some operations in common with lists, and some
differences. A dictionary is created with curly
braces; new key-value pairs are added by specifying the
key in brackets; values are also retrieved using square brackets
like with lists, but the indices need not be numbers; you can
get the number of key-value pairs in the dictionary
with len(); and (importantly!) you can
check if a key is already in a dictionary with
the in command:
>>> d = {}
>>> d["hair"] = "orange"
>>> d["species"] = "monster"
>>> d["name"] = "Gritty"
>>> print(d)
{'hair': 'orange', 'species': 'monster', 'name': 'Gritty'}
>>> d["hair"]
'orange'
>>> len(d)
3
>>> "name" in d
True
>>> "age" in d
False
Just like with lists and tuples, you can combine dictionaries with lists in all sorts of ways. First I'll put a list into my dictionary, then I'll create another dictionary and put them both in a list:
>>> d["lucky numbers"] = [ 4, 11, 42, 101 ]
>>> d
{ 'hair': 'orange', 'species': 'monster', 'name': 'Gritty',
  'lucky numbers': [4, 11, 42, 101] }
>>>
>>> d2 = {}
>>> d2["hair"] = "brown"
>>> d2["species"] = "human"
>>> d2["name"] = "Rory"
>>>
>>> ds = [ d, d2 ]
>>> ds
[ { 'hair': 'orange', 'species': 'monster', 'name': 'Gritty',
    'lucky numbers': [4, 11, 42, 101] },
  { 'hair': 'brown', 'species': 'human', 'name': 'Rory' } ]
This all might seem fairly abstract at the moment, but we'll work through some examples today which will hopefully add some concrete understanding and clarity.
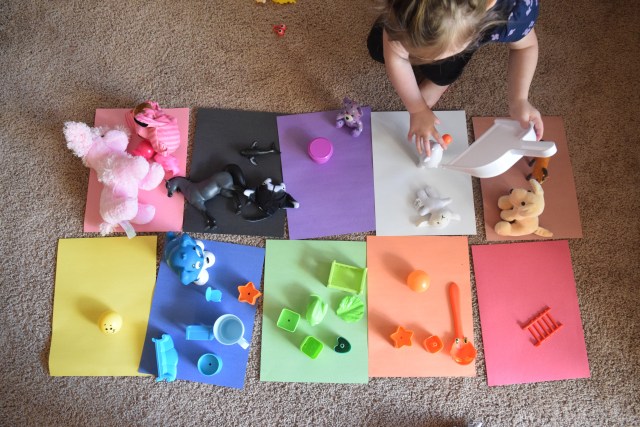 We can use dictionaries like buckets, to
count things like colors in an image.
We can use dictionaries like buckets, to
count things like colors in an image.
III. Using data structures to gather data
For the moment, let's continue working with images since you've been getting familiar with the Pillow image library. Let's calculate a histogram for the colors of an image. A histogram is usually a chart, where the x-axis indicates many buckets, and the y-axis indicates how many times that bucket occurs in some data set. (We talked about this briefly when we discussed randomness.) In this case, we won't actually draw this chart, but conceptually, the horizontal axis represents all pixel colors in an image, and for each one, we want to count how many times it occurs. This is a great use for a dictionary.
Start by importing Pillow, opening an image file, and getting its size:
from PIL import Image

img = Image.open("fire.jpg")

(width,height) = img.size
(Now hopefully you have some insight here and can see
that img.size gives us a tuple,
which is why we need the parenthesis on the left of the equal
sign.)
Next, let's create a new dictionary. Remember that a dictionary stores a set of key-value pairs. In our case, the keys of this dictionary will be colors (represented by tuples), and the value corresponding to each tuple will be how many times it has occured:
from PIL import Image

img = Image.open("fire.jpg")

(width,height) = img.size

color_counts = {}
Let's start by looping over the image and getting the color value for each pixel:
from PIL import Image

img = Image.open("fire.jpg")

(width,height) = img.size

color_counts = {}
for x in range(width):
    for y in range(height):
        p = img.getpixel((x,y))
Now, we'll use that pixel value p as the key in our
dictionary. If this color (this key) is already in
the dictionary, then we want to increment its value. But if the
key is not in the dictionary (else),
we'll simply add it to the dictionary with an initial value
of one (1):
from PIL import Image

img = Image.open("fire.jpg")

(width,height) = img.size

color_counts = {}
for x in range(width):
    for y in range(height):
        p = img.getpixel((x,y))
        if p in color_counts:
            color_counts[p] = color_counts[p] + 1
        else:
            color_counts[p] = 1
That's all there is to it for calculating the number of color
occurences. But what if we now wanted to determine the most
frequent color of this image? Think back to the work
from Unit
1, Lesson 2 about finding the largest or smallest number
in a list. We can re-use that algorithm here.
The new code in blue starts by
temporarily assuming that the most frequent color is the first
pixel in the image — i.e. the top-left pixel specified
by (0,0). Then the line for p in
color_counts loops over every key in the
dictionary (i.e. every color) and for each one, it
asks if the value corresponding to
that key (i.e. the number of occurences of that
color) is greater than the number of occurences of the
current most_frequent_color. If it is
greater, then that color becomes the
new most_frequent_color. I hope this algorithmic
pattern seems pretty familiar to you by now!
from PIL import Image
img = Image.open("fire.jpg")
(width,height) = img.size
color_counts = {}
for x in range(width):
for y in range(height):
p = img.getpixel((x,y))
if p in color_counts:
color_counts[p] = color_counts[p] + 1
else:
color_counts[p] = 1
print( "There were " + str( len(color_counts) ) +
" total colors in this image.")
most_frequent_color = img.getpixel((0,0))
for p in color_counts:
if color_counts[p] > color_counts[most_frequent_color]:
most_frequent_color = p
And that's all there is to it. Now we can just print out the results of our calculation:
Example 1: Counting color occurences in an image.
from PIL import Image

img = Image.open("fire.jpg")

(width,height) = img.size

color_counts = {}
for x in range(width):
    for y in range(height):
        p = img.getpixel((x,y))
        if p in color_counts:
            color_counts[p] = color_counts[p] + 1
        else:
            color_counts[p] = 1

print( "There were " + str( len(color_counts) ) +
       " total colors in this image.")

most_frequent_color = img.getpixel((0,0))
for p in color_counts:
    if color_counts[p] > color_counts[most_frequent_color]:
        most_frequent_color = p
print("The most frequent color is: " + str(most_frequent_color) +
" and it occurs " +
str(color_counts[most_frequent_color]) + " times.")
For the homework, I will show you how to open up a text file instead of an image file, and will challenge you to implement this same algorithm for words in teh file instead of pixel colors in the image, in order to determines the most frequent words in a text.
IV. Data and metadata
This week I'm asking you to read an article about metadata by Matthew Mayernik. In it, he explains that the term "metadata" likely originated in the late 1960s "in the context of computer system design to refer to the use of one data element to describe or represent some characteristic of another data element." [1] In other words, it's data about other data.
We might debate the usefullness of this distinction (after all, isn't it all, just, data?) and perhaps there is some ideological baggage that this comes loaded with in terms of computer scientists wanting to create this distinction - as if to say that as a field, it does not want to get its hands dirty mucking about with actual data itself, which might be the messy, poorly structured stuff of culture and humanistic communication. But it is a distinction that seems to have some usefulness, and while Mayernik does not offer any hard and fast definitions, he lists many other contenders, such as "data attributes that describe, provide context, indicate the quality, or document other object (or data) characteristics." [2] Let's go with that ... and let's see if we can manage some successful metadata experiments that use these data attributes to provide context or analysis about some data objects.
The type of metadata that I'd like to start exploring is Exif data. This term stands for "exchangeable image file format", and it refers to a number of standardized fields that can be embedded in image files, currently only JPG and TIFF image formats. Exif data can include information about the camera device that was used to take the picture, including numerous photographic settings on that camera; it can also include information about the resolution and color properties of the image; and it can include contextual information like the date, time, and location of where and when the photo was taken.
As you are probably thinking, this can pose some serious privacy concerns. One high profile case illustrating this is the story of John McAffee, who was on the run, and whose location was then revealed to be Guatamala after doing an interview with Vice media, who left GPS information embedded in Exif data on photographic images they took of him. (thenextweb.com)
Exif data can be very challenging to work with in a reliable way. First of all it is usually only included in photographic images, not other types of graphics or images created with other tools. Also, not all cameras save the same fields. And lastly, owing to the privacy concerns (see sidenote below) many platforms strip out some or all of the Exif data in images before sharing them on their platforms. So while most of the pictures you take with your phone probably have this embedded, trying to find images on the internet with these fields embedded can be frustrating.
Privacy? I would argue that concern for privacy is not necessarily the primary motivating concern for why these platforms strip Exif data from images before publishing them. For one, most of these platforms, such as Facebook, have proven themselves to be wholly unconcerned with the privacy of their users. On the contrary: their entire business model is predicated on extracting as much data about their users as possible. I contend that the performance of privacy concern regarding Exif data is actually a way of holding on to as much data as they can. After all, it is not the case that these companies ignore Exif data. Rather, they strip it out and save it for their own uses. Facebook and Google will show you where a photo was taken, even though they don't let you collect this data from files yourself. Removing it from the photo files that are published, I argue, is a way for them to prevent everyone from deriving value from this data and to maintain exclusive access to it.
For this work, I will work with a collection of 15 images. I saved these from Flickr, and I found them by doing a search for "people", sorted by "most interesting" (a property which Flickr determines by means that I'm not aware of) and filtered to only allow images with a Creative Commons license. Most of these have Exif data, but not all. I plan to work with these images as examples over the next couple weeks. You can find a zip file containing the folder of images here.
We can get started by playing around with Exif data in the
Python shell. Make sure that you download and unzip that folder
of images. Move it to the folder where you want to keep it, and
then cd to the parent of that
folder to be able to access the images from Python. In other
words, you should be able to type ls
and see the people folder in the
listing.
>>> from PIL import Image, ExifTags
>>> img = Image.open("people/11767919503_335aa61249_o.jpg")
>>> img.getexif()
<PIL.Image.Exif object at 0x7fba16ed2a60>
These few commands simply import the libraries we
need to work with this, opens an image, and gets the Exif data
for that image. What we have here is an object, which we can
treat like a dictionary. But in order to do that we have to
figure out what the keys
are. img.getexif().keys() will give us
that, but we have to loop to see these. This should work:
>>> for key in img.getexif().keys():
...   key
...
36864
37377
37378
36867
36868
# etc ...
But what's this? We can't tell what these keys are supposed to
represent. Unfortunately the Exif standard dictates that all the
keys should be these numeric codes. Fortunately there are
commands that can help us figure out what these keys mean. That
is what the ExifTags library is for that we
imported above. ExifTags gives us its own
dictionary. This one contains key-value pairs that translate
numeric Exif codes into human-readable descriptions:
>>> for key in img.getexif().keys():
...   print( str(key) + " corresponds to: " + ExifTags.TAGS[key] )
...
36864 corresponds to: ExifVersion
37377 corresponds to: ShutterSpeedValue
37378 corresponds to: ApertureValue
36867 corresponds to: DateTimeOriginal
36868 corresponds to: DateTimeDigitized
# etc ...
OK, now we're getting somewhere.
Enough experimenting in the Python shell. Let's make a new Python computer program by putting these commands into a file so that we can re-use the commands by re-running the computer program without typing them all in again each time.
In this file, let's make a loop that loops over all images in this folder and tries to print some metadata about each one. I'll see if I can print the value of the key 36867, which corresponds to "DateTimeOriginal", which I presume is meant to indicate the day and time when the photo was taken — I assume this would be determined by the date and time on the camera as set by the user, so this probably is not super reliable, but it might be interesting.
from os import listdir
from PIL import Image, ExifTags

files = listdir("people")

for f in files:
    img = Image.open( "people/" + f )
    exif_dictionary = img.getexif()
    date_time = exif_dictionary[36867]
    print(date_time)
Running this from the command line for me yields the following output:
$ python exif.py
2016:03:12 14:37:08
2008:04:12 13:34:59
2018:02:05 17:34:50
2015:03:29 15:24:02
2016:04:10 14:25:22
2014:06:07 21:00:58
2012:02:28 13:09:19
Traceback (most recent call last):
  File "exif.py", line 9, in <module>
    date_time = exif_dictionary[36867]
  File "/Users/rory/Library/Python/3.8/lib/python/site-packages/PIL/Image.py", line 3471, in __getitem__
    return self._data[tag]
KeyError: 36867
This is easy enough to fix. We got an error because one of the
images does not have this Exif key. Remember that we can use
the in command to check:
from os import listdir
from PIL import Image, ExifTags

files = listdir("people")

for f in files:
    img = Image.open( "people/" + f )
    exif_dictionary = img.getexif()
    if 36867 in exif_dictionary:
        date_time = exif_dictionary[36867]
        print(date_time)
Running that command, now I can see the date / time for all images that contain this field, and my program simply skips over images that don't contain it.
Can you start to think about some things that we might do with this data? In the homework I'll ask you to try to sort the images based on date, or any other Exif field you wish.
In working with this Exif stuff, it is useful to have a non-programmatic tool to quickly access the Exif (meta)data. I can recommend this simple online tool: http://exif.regex.info/exif.cgi. I have been using it and it works well for me. There are many other ways you could access this. On Mac I believe you can use built-in tools such as clicking the file in Finder, and then clicking File > Get Info.